Numerical experiment and fitting formulas.
Results of numerical experiment for simulation of crystal growth are presented together with analytical-like fitting formulas with coefficients derived from mathematical constants for presentation growth rate, surface roughness and concentration of hole-like defects in broad range of parameters.
Numerical simulation of crystal growth produces practically applicable results for at least two mutually complimentary areas of materials research and development:
- A comparison of shapes, purity and sizes of crystals found in nature with results of numerical experiments provides to researcher valuable information to make educated assumptions about conditions earths minerals and out of space pieces like meteorites, moon and other out of space rocks are formed in.
- An optimization stage of development widely used in industry crystalline materials can be significantly accelerated by replacing al least partially lengthy and expensive tries and fails routines of material world experimentation with computer simulation, or even better, with fitting formulas obtained by analysis of series of numerical experiments.
Initial parameters for numerical simulation of crystal growth.
There are kinetic, thermodynamic and crystallographic initial parameters defining conditions of numerical experiment for crystal growth via calculated probabilities for any given molecule on the surface to make a move ahead, back or stay depend on any combination of its neighbor molecules:
- - thermodynamical parameters as it is shown in article "Physical background of the model for numerical simulation of crystal growth" can be reduced to two unitless variables: specific supercooling ΔG` and specific surface energy σ`.
- - a shape of the molecule provide most variety for initial conditions of experiment defining how effective square of molecule is distributed along different directions of molecule. All at all there can be up to 6 independent parameters defining shape of the molecule (in LeoMonteCrystal we reduce them to 5 with premise that surface distributed along edges proportionally their length).
- - a kinetic parameter of growth can be considered as a temperature scale factor in the complete set of parameters. It is presented and has the same value for all levels of abstraction used for description of crystal growth conditions and thus in some manner is inconsequential for output of numerical experiments performed for identical set of thermodynamic and crystallographic parameters.
Output parameters of numerical experiment for simulation of crystal growth.
A single numerical experiment of crystal growth provides three major quantitative characteristics of expansion of the crystal surface in the given direction of its crystal lattice:
- Growth rate, V, is measured in units usually used for definition of velocity can better be presented as unitless coefficient, Vise, that shows Influence of Surface Energy on growth rate, that can be presented by formula: V = Vise *Vc, where, Vc - theoretical growth rate for continues mechanism, that is calculated by Turnbull equation. If simulation algorithm includes consideration of formation hole like defects a value of growth rate could be larger than predicted by continues mechanism, thus Vise could overpass value 1.0 that complicates finding fitting formulas. To compensate porosity effect on v it defines as corrected by coefficient cp = 1/(1+p) , where p - porosity that will be introduced later. For convenience sake from this point coefficient Vise will be represented by the small cap letter v and nicknamed as growth coefficient.
-
Surface roughness, R, has meaning of standard deviation
from average positions of molecules on the surface of growing
crystal. If distance is measured in heights of the molecules (or what is
the same here in layer heights) units, the R has unitless
value of number of layers in given crystallographic direction.
The R value gives the most direct numerical criteria for mechanisms
of the growth.
Tree possible mechanisms of growth are conventionally recognized can happen for given initial parameters: two-dimensional nucleation, continuous and intermediate . Roughness of the surface gives most apparent criteria for distinguishing between these mechanisms. In case of two-dimensional growth most molecules are located inside flat basic layer with some number of molecules randomly landing in and out on it and occasionally clustering into two-dimensional nucleus these are spreading into next base surface. This is the only situation when one can introduce a formula for calculation of a concentration of single molecules, c, these are located on the flat surface. Roughness of surface in case of reasonable small concentrations of single molecules on the flat surface can me expressed by formula R = c*(1-c). It is self-evident that for concentration above 0.5 there is no sense to talk about flat surface. So roughness above R>0.25 represents upper border for attribution of the growth to pure two dimensional mechanism. The same situation when R>1 gives a clear identification of the growth by continuous model. - For R in between from 0.25 to 1.0 the growth happens by intermediate mechanism.
- Concentration of defects, p, is an unitless value that has meaning of a concentration of the hole like defects trapped under surface during the growth. Mathematically the value p is defined as number of empty (or filled with impurities if it is real life situation) positions of molecules (structure elements) inside crystal divided by number of all available positions. This is one of the most practically important characteristics of the crystal quality that can be obtained from numerical simulation experiment. The concentration of defects defines perfection of the crystal in sense of its purity. Oppositely in rare cases when special doping is needed for achieving special property (optical, electrical, etc.) of material a choosing conditions of growth to have desirable concentration could achieve the goal during the growth stage instead of conventional methods like diffusion or ion implantation.
The ultimate goal the numerical experiment is to find analytical mathematical expressions these are connected these main output parameters of numerical simulation experiment with initial set of characteristics of growth for any given set of initial parameters. There are also several other characteristics of the growth these have lesser significance from practical point of view but these also can be revealed by the numerical experiment: frequency of formation of two dimensional critical nuclei on flat surface; concentration and distribution of molecule clusters on flat surface and the rate of establishing quasi equilibrium conditions of growth after changing temperature or concentration. More detail systematic research of these secondary phenomena of should be topic for future projects.
Molecule of the given size and shape.
For molecules of given topology that is defined by its shape plus distribution of chemical bonds along its surface results of experiment can be presented as a functions of two variables: general supercooling (ΔG`) and specific surface energy (σ`) defined by the formulas 13 and 14 presented in the the chapter "Physical background of the model for numerical simulation of crystal growth". For such given molecule these two variables represent complete set of parameters. In LeoMonteCrystal a molecule is described as cuboid like figure with three length dimensions and distribution of surface energy along faces, edges and vertices of the cuboid.
Following charts on the Fig.1 show results obtained for three full series of numerical simulation experiments for molecules of given shapes made with the help of option " Full research for molecule of given shape" of run menu of LeoMonteCrystal. Main parameters of the growth are presented in form of lines with equal value of general supercooling varying specific surface energy.
| Fig. 1 | ||
|
1 |
2 |
3 |
_6_6_6_0_0.jpg)
|
_6_6_6_1_1.jpg)
|
_8_6_3_05_025.jpg)
|
|
Curves of rate coefficient (v); roughness (R);
porosity (p) as a functions of specific surface energy
with constant general supercooling for molecules of with given cuboid shape and
distribution of the surface along their faces, edges and vertices:
1) a = 0.6 nm, b = 0.6 nm, c= 0.6 nm and Se/Sf = 0, Sv/Sf = 0; 2) a = 0.6 nm, b = 0.6 nm, c= 0.6 nm and Se/Sf = 1, Sv/Sf = 1; 3) a = 0.8 nm, b = 0.6 nm, c= 0.3 nm and Se/Sf = 0.5, Sv/Sf = 0.25. |
||
Results of simulation shown on the Fig. 1 for molecules for all of three different shapes and distribution of the surface are qualitative homogonous if scaled by coefficient for specific surface energy. Quantitatively these results are apparently distinct. If for instant to compare results for rate coefficient in all three cases scaled coefficient has clear different values for low (v<0.2) and high (v>0.8) areas of charts.
Nevertheless clear similarity of results for different shape and distribution of surface molecules gives a reason to suggest that instead of seven independent variables: five for shape and surface distribution and two general thermo-dynamical ones, lesser number of united parameters can be enough for fitting results of numerical experiments.
Fitting formulas.
Because even single numerical experiment for simulation of the crystal growth is a time consuming procedure that can take from minutes to hours it could be highly beneficiary to discover analytical formulas to fit with good accuracy series of numerical simulation experiments to get results virtually instantly. It will help to farther advance computer aid design to the area of production of crystalline materials. Thus the most valuable output of analyzing series of numerical simulation of crystal growth could be finding adequate analytical formulas these could replace procedure of numerical experiment with direct calculation of corresponding formulas.
The command of menu item Run/Action/General experiment of LeoMonteCrystal runs series of experiments covering initial parameters as they set in "General experiment dialog". Following table shows border values of initial parameters and obtained results for such general experiment. Relatively small part of results was purged on the base of demanding too long duration of single experiment to reach reliable outcome for given parameters. There are 10446 simulations in the series with parameters are in a range shown in a following table:
| Initial parameters | Low border | High border |
| Thermodynamic: | ||
| g, general supercooling | 0.01 | 15 |
| s, specific surface energy | 0.65 | 81 |
| Shape and surface distribution of molecule: | ||
| Ka = a/(b*c)0.5 | 0.0143 | 24.4 |
| Kbc = = (b*c)0.5/(0.5*(b+c)) | 0.203 | 1 |
| Se/Sf | 0 | 10 |
| Sv/Sf | 0 | 10 |
| Results of simulation: | ||
| v, rate coefficient (parts) | 0.005 | 0.98 (all larger are cleansed). |
| r, roughness (layers) | 0 | 5.04 |
| p, porosity (percents) | 0 | 20 |
Series of simulations for molecules of given shape and along surface distribution shown at Fig.1 demonstrate a resemblance of corresponding curves of v(s), r(s) and r(s) for given g. It provides a rational to explore a possibility that number of initial parameters defining results could be reduced from seven to smaller number of united (composed from initial) arguments. After numerous tries it has been found that for an approximation of v, rate coefficient, roughness of surface and porosity, with analytical formulas there are three unified unitless parameters needed to reach satisfactory concurrence with experiment:
- g, general supercooling;
- s1, a change of the system energy in case of emitting a stand alone molecule located at the flat surface measured as part of specific surface energy,
- s11, a change of the system energy in case of emitting a molecule that is situated upon the stand alone molecule measured as part of specific surface energy.
It is interesting to point out that parameters s1 and s11 have equal values when all surface of molecule is localized along faces of the cuboid what is happened for Se/Sf = 0, Sv/Sf = 0.
In terms described in article " Physical background of the model for numerical simulation of crystal growth. ", parameters s1 and s11 are calculated by formulas:
|
s1 = s *(1 - 2*(Sa + 2*Sab
+2*Sac + 4*Sabc))
s11 = s* (1 - 2*Sa) |
(1) |
where Sa - part of surface of molecule belonged to base face of molecule; Sab, Sac are parts of surface belonged to edges on its bottom (top); Sabc - parts of surface belonged to edges.
A formal approximation.
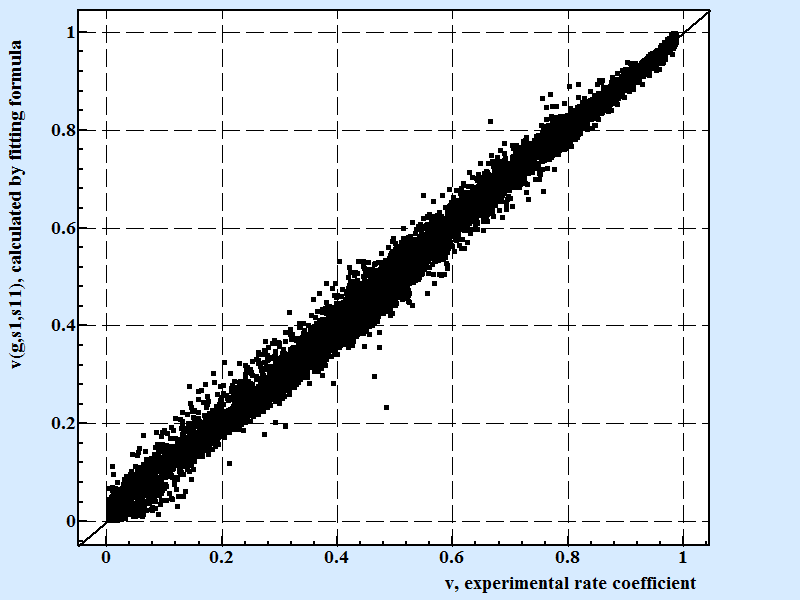
We use data analysis software application LeoDataAnalysis that implements our state of art algorithms for search of the best multivariate approximation formula with randomly constructed terms. From this point and later on the rate coefficients v is used in modified form corrected by coefficient (cp = 1/(1+p) ) that is taken into account a formation of porous like defects. The formula with arguments for approximation of rate coefficient, v(g,s1,s11) was constructed and values of fitting coefficient are found. Fig. 2 displays correlation between experimental and calculated by the fitting formula values for the v, rate coefficient,:
| Fig. 2 |
|
|
Correlation between experimental results for rate coefficient
and calculated by fitting formula:
v(g,s1,s11) = exp(-exp(-(-0.018563*pow(s1,2)*pow(s11,0.25)*pow(g,-(2/3)) + 2.8703*pow(s1,(1/3))*pow(s11,-0.5)*pow(g,(2/3)) -1.4951*pow(s1,0.75)*pow(s11,-0.75)*pow(g,0.5) -0.70004*pow(s1,0.25)*pow(s11,0.25)*pow(g,0.25) + 0.039524*pow(s1,0.75)*pow(s11,0.75) + 1.139e-7*pow(s1,6)*pow(s11,(2/3))*pow(g,-2) + 0.001646*pow(s1,-(1/3))*pow(s11,2)*pow(g,-0.25) + 0.3412*pow(s1,(2/3))*pow(s11,-(2/3))*pow(g,-(1/3)) -1.722e-6*pow(s1,0.25)*pow(s11,3)*pow(g,0.25) + 1.0693*pow(s1,-(1/3))*pow(s11,-0.25) -1.888e-7*pow(s11,-0.5)*pow(g,6) -7.168e-7*pow(s11,4)*pow(g,-0.75) + 2.751e-5*pow(s1,-0.5)*pow(s11,-5)*pow(g,9) -1.053e-10*pow(s1,6)*s11*pow(g,(1/3)) + 6.939e-10*pow(s1,0.25)*pow(s11,5) + 0.8943*pow(s1,(1/3))*pow(s11,-2)*pow(g,-(1/3)) -0.354*pow(s1,0.25)*pow(s11,-3)*pow(g,0.75) + 2.851e-12*pow(s1,6)*pow(s11,(2/3))*pow(g,2) -0.04282*pow(s1,-1)*pow(g,-0.25) + 0.04333*s1*pow(s11,-2)*pow(g,2)^1.15)) Coefficient of variation for the formula presenting above that contains 21 fitting coefficients is 0.902 for 10602 points. |
The shown above formula v(g,s1,s11) contains 21 fitting coefficients. The coefficient of variance for >10000 points is 0.902. The formula is constructed in a way to produce results in a range from 0 to 1.0 as it should be for corrected for porosity rate coefficient. The number of fitting coefficients here is chosen arbitrary to fit condition when adding coefficients in polynomial part of the formula apparently does not significantly improve overall fitting. Number of coefficients in between 12-20 had happen to be in tact with overall precision of the experiments in the series.
Although this pure mathematical, formal approach for fitting results with polynomial formula gives very small if any information about mechanism of growth it delivers a significant conclusion that three arguments: g,s1,s11 are indeed enough for describing crystal growth rate.
It is important to notice that there are practically infinite numbers of fitting formulas like presented in Fig.2 these fit results with almost the same or even better accuracy. In some sense these fitting procedure have mostly utilitarian purpose except demonstrating sufficiency of three parameters g, s1,s11 to describe experiment.
The quest for construction of analytical and semi-theoretical formulas.
Much more informative and convincing result could be a finding fitting semi-theoretical formulas with structure reflecting physical reality of the crystallization process. The description of the formulas as semi-theoretical reflects the fact that structure of the formula was found empirically analyzing internal correlations of results of numerical simulation experiments instead of being derived from fundamental laws of physics that could be not possible at all for crystallization phenomena due to mathematical complexity.
The first discover on the long endeavor to construct semi-theoretical formula was revealing the existence a point of growth mechanism transformation from primary layer by layers into continuous (rough surface) one and mathematically defined conditions for this transformation.
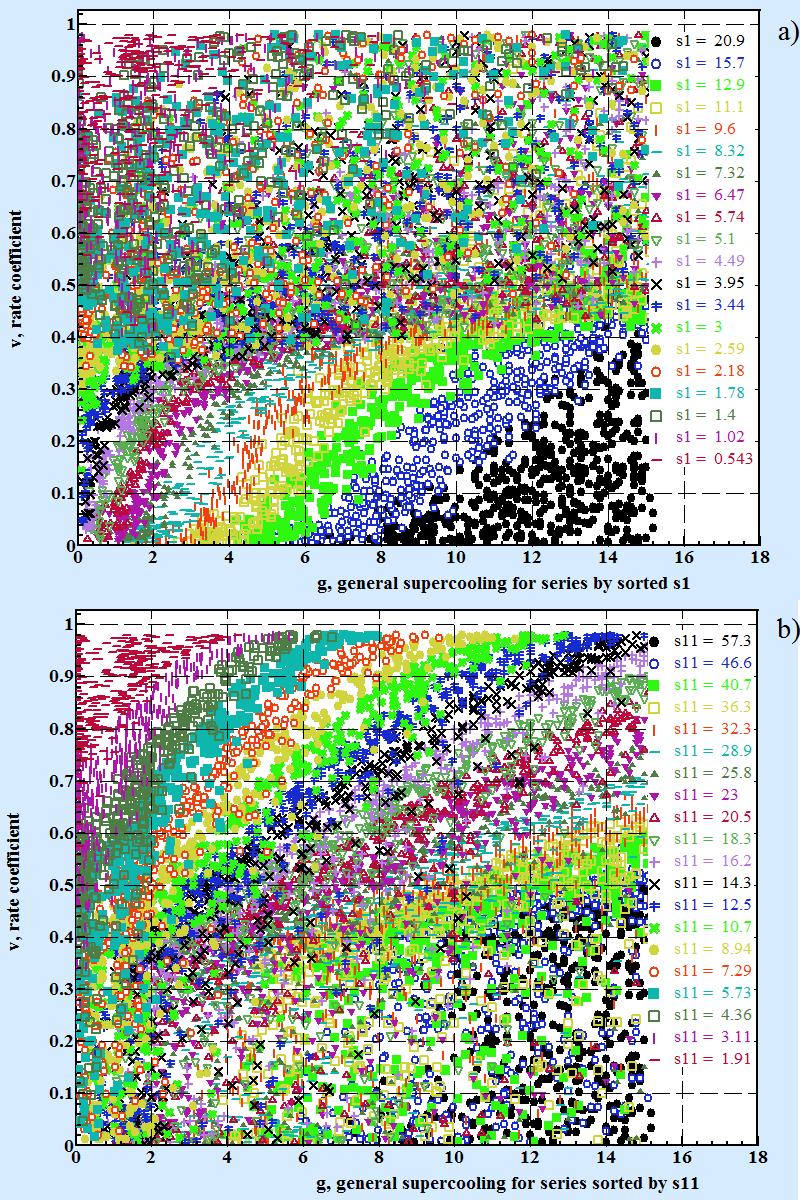
The Fig.3 shows series of experimental points grouped by values s1 for Fig 3.a and by s11 for Fig3.b. All points from numerical experiment was sort out by s1 or s11 and divided into equal by number groups.
| Fig. 3 | ||
|
||
|
Series of v(g) for values:
a) s1 sorted descended and split into 20 series with equal number point in each of them; b) s11 sorted descended and split into 20 series with equal number point in each of them. Average values of s1 and s11 in series are shown on the picture. |
As Fig.3 clear shows:
- when v < ≈ 0.3 for given values s1 experimental points at the v-g chart are gathered around distinct curves v(g). For given s11 in this area when v < ≈ 0.3 there is no correlation between v and g.
- when v > ≈ 0.3 as Fig.3.b shows the situation is inverting toward value s11. For given values s11 experimental points at the v-g chart are gathered around distinct curves v(g). For given s1 in this area when v > ≈ 0.3 there is no correlation between v and g.
Data presented at Fig. 3 has to make an hypothesis that at low and high areas of rate coefficient there are two distinct mechanisms of growth take place with transition rate located for value of rate coefficient around 0.35 (specifically at vt = exp(-1) ≈ 0.3678). So it is logical to assume that for description of dependence rate coefficient v as function g, s1, s11 there must be at least two analytical formulas v = Fl (g,s1) and v = Fh (g,s11) applicable below and above vt.
It had happened that construction of such conditional formula can be based on the curve v(g) for given s1 and s11 that is combination of two functions passing three pin base points in coordinates v - g:
-
Minimum rate point is the value of the growth coefficient
for zero supercooling: [0,v0] . It has
meaning of minimum possible value of rate coefficient for given
surface of the crystal when supercooling goes to null . Opposite to commonly
shared perception it means that even for zero supercooling the
surface is not absolute flat so there is some non-zero value
of rate coefficient even for g = 0. We are found that
value of minimum growth rate can be represents by function:
v0 = exp(-0.25 * s12) (2) -
Transition point corresponds to the supercooling at which
transition from mechanism of spreading two dimensional islands
at smaller supercooling into sporadic growth of increasingly (with growth
of supercooling) rough surface changed happens: [gt,
vt]. The best representation of the transition point is
vt = exp(-1) and
gt = -a1*s1^-1/3*s11^-1+a2*s1^2*s11^-3/4+a3*s1^1/2*s11^2/3 (3) where a1 = π×π ≈ 9.8696, a2 = 0.25, a3 = 0.5×σ ≈ 0.17661; π ≈ 3.14159 - Archimedes constant, σ ≈ 0.3532363719 - Hafner�Sarnak�McCurley constant.
-
Maximum meaningful supercooling point g1(s11)
represents a limit of supercooling after reaching it the growth rate
is equal to maximum value 1: [g1,1]. It is
uncomfortable introducing this point as sharp break of the curve
v(g) at the theoretical high limit of growth rate
coefficient when v = 1. According physical sense of the crystallization
phenomena it should be asymptotical approaching v → 1.
Unfortunately the limitations on the computation power doesn't
permit detail enough research to clarify behavior of the
v(g) in very close proximity of the growth coefficient
to its maximum value. The best analytical representation
of formula for the maximum supercooling point that we found is:
g1 = Φ*s11 + φ * s110.5 (4) where coefficients Φ and φ are golden ratio numbers: Φ ≈ 0.61803; φ ≈ 1.61803
The curve v(g) consists in general case from two functions first of them vl connected minimum rate point, [0,v0], with transition point, [gt, vt], by formula:
| vl = exp(-0.25 * s12 * exp(-f*g0.5)) | (5) |
where coefficient f is the solution of the equation (5) when vl = vt the transition point:
| vt = exp(-1) = exp(-0.25 * s12 * exp(-f*gt0.5)) | (6) |
that brings us the formula for coefficient f:
| f = - (1/gt)0.5 ln(4*s1-2) | (7) |
and finally expression for calculation of the rate coefficient for mechanism layer by layer growth:
|
vl = exp(-0.25* s12 *exp(ln(4*s1-2)*(g/gt)0.5))
|
(8) |
The transition point, [gt, vt], is connected with maximum meaningful supercooling point, [g1,1], by the formula for increasingly manifestation of the continues mechanism of growth:
|
vh(g) = exp(-((g-g1)/(gt-g1))2)
|
(9) |
Final conditional formula for whole interval of supercooling is presented in following table:
|
(10) |
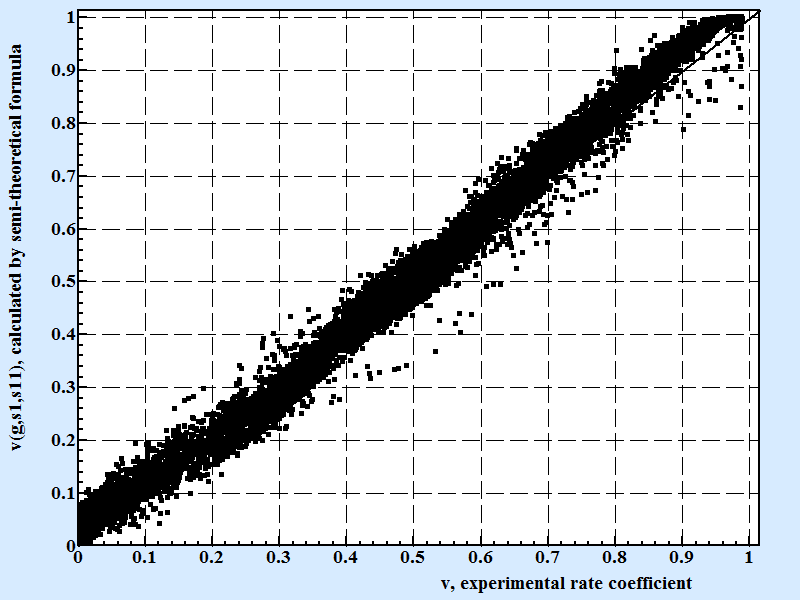
The Fig.4 shows a correlation between experimental points and calculated by the conditional formula (10) presented above:
| Fig. 4 |
|
| Correlation between experimental results for rate coefficient and calculated by semi-theoretical conditional formula 10. Coefficient of correlation for the semi theoretical formula presenting above is 0.8734 for 10607 experimental points. |
We consider the formula 10 as a breakthrough achievement for the understanding process of the crystal growth by following reasons:
Formula 10 contains only mathematical constants, rational numbers and elemental functions for calculation of the rate coefficient in the whole possible range of supercooling, surface energy and geometry of molecules.
To reach the same or better correlation using process of modified least square method approximating the same set of numerical simulation data one need to use multivariate polynomial formula with at least 9 fitting coefficients in it that makes this formula pure formal mathematical excises that can gives only one helpful information - the fact that formula for rate coefficient as function of three unified arguments is existed and gave an inspiration for the search meaningful formula with physical sense in its structure like formula 10 is.
Formulas for roughness and concentration of the defects.
It had happen that structures of the formulas for surface roughness and concentration of hole like defects are differ from that for rate coefficient. If curve v(g) is passing three pin points on the chart v - g formulas for roughness r(g) and concentration of the defects are contained from two multiplied formulas. First formula is active in whole interval of supercooling and second formula plays a role of coefficient below transition point and reflects additional effect of layer by layer mechanism. Following conditional formulas are shows the final expression for these semi-theoretical formulas:
| if | r(g) | p(g) | (11) |
| g >= 0 and g <= gt | r(g) = rl(g,s1)×rh(g,s11) | p(g) = pl(g,s1)×ph(g,s11) | |
| g >=gt | r(g) = rh(g,s11) | p(g) = ph(g,s11) |
where:
| rh = 2*30.5×g2/(s112+π2)+2×e/(s112+0.5*e)+e-1/e | (12) |
| rl = exp(-0.25×(gt - g)0.5×s1Φ/2) | (13) |
| ph = exp(-(π×g/(g+π-2)+s11×0.5/(g+(3/4)2))) | (14) |
| pl = exp(-exp((e - 3×φ×g0.5))×s12×π×g/(g+π)) | (15) |
where definitions of the constants are given already for growth rate coefficients formulas.
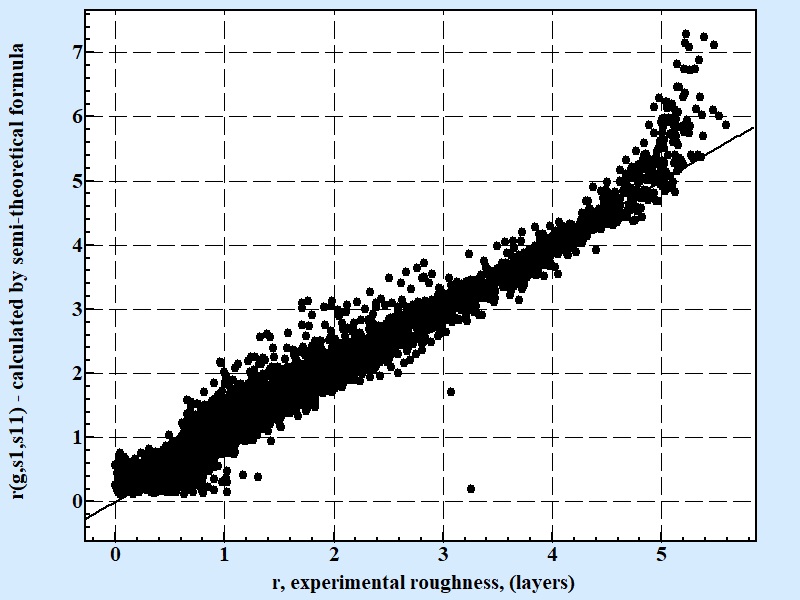
| Fig. 5 |
|
| Correlation between experimental results for roughness and calculated by semi-theoretical conditional formula 11. Coefficient of correlation for the semi theoretical formula presenting above is 0.79 for 10607 experimental points. |
| Fig. 6 |
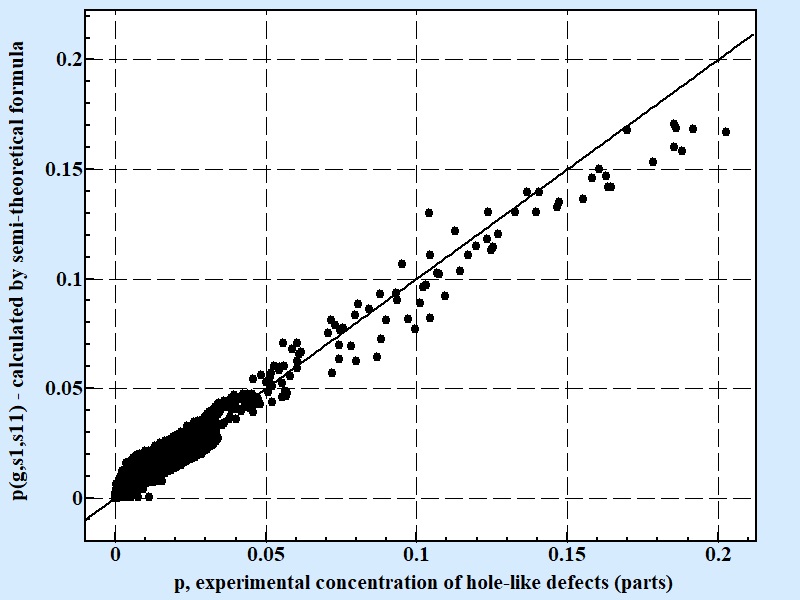
|
| Correlation between experimental results for concentration of hole-like defects and calculated by semi-theoretical conditional formula 11. Coefficient of correlation for the semi theoretical formula presenting above is 0.76 for 10607 experimental points. |
Fitting formulas presented above are incorporated into data panel of LeoMonteCrystal application. This panel provides for given set of initial parameters a prediction of growth rate and shape of the crystal as well temperature curves of growth rate, surface roughness and concentration of the defects in direction of the growth.
Found fitting formulas are clearly in general agreement with numerical experiment. The fact that all coefficients in them are mathematical constants provides additional argument to relay on their validity. Border areas of experiment with v → 0 and v → 1 are still in need for more detail experiment that demand in times more power computation instruments.
Nov. 6, 2017; 09:09 EST