Estimation of crystal surface energy.
Surface energy of a crystal is in the same time one of the most important characteristics for any theoretical concept described a kinetic of crystal growth and is highly difficult for direct measurement in experiment. The simple formula for estimation of surface energy on the base of presumption that surface energy is concentrated inside depth of one atomic layer is presented and tested.
A phenomenon of surface energy plays a central role in analyses of most aspects of phase transitions in general and crystallization specifically. If for liquid phase a surface energy (tension) can be measured directly for crystals such measurements are practically impossible to carry out with any level of reliability. Most pronounce phenomena where surface energy of crystalline phase could be estimated on the base of experimental data are kinetic of crystal nucleation and growth. Nevertheless this avenue of research has met with many complications among them is lack of reliable experiments measured with great accuracy crystal growth rate and nucleation.
A numerical simulation of crystal growth phenomena explicitly demands to set value of surface energy as one of the most influential input parameter. At very least one could want to get reasonable estimation of its value as starting point for defining a range of surface energy values to test.
A commonly accepted explanation for surface energy phenomena and its other manifestation, surface tension, is distortion of central like symmetry of chemical bond forces for atoms on the crystal surface comparable to atoms inside solid or liquid phases. In publication [1] the calculation of surface energy are coming from a thought experiment. If split a crystal by half creating two new surfaces and do estimate energy that operation should take. This energy has to be equal energy for breaking all chemical bonds along splitting surface. The bond energy there is associated with the heat of sublimation.
Embracing in general approach described above one could point out on obvious limitations for its direct application any other cases except such crystals these have known topology of chemical bonds and measured in experiment sublimation energy in vacuum. In this article more general approach will be evaluated and compared with well established data for surface energy of several liquids.
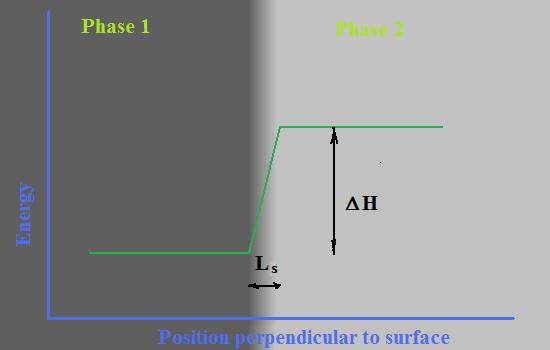
Let presume that Phase 1, with lower level of energy (crystal or liquid) is in direct contact with other phase, Phase 2, (crystal, liquid or gas). A difference between energy levels in these two phases is directly measurable parameter called heat of phase transformation or change of enthalpy - ΔHv -specific volume enthalpy of phase transition. Let’s also presume that there are border layer between there two phases with effective thickness, Ls, where energy level changing linearly as it is shown at Fig. 1. It is worth to note that linear function of changing energy level is obviously only a rough approximation of reality that is necessary to be able to characterize the border layer by single parameter - Ls.
A value of surface energy in such model can be defined as average energy of surface layer that will be assigned to Phase 1 and calculated by formula:
σ =0.5* ΔHv * Ls(1)
A coefficient 0.5 reflects linear slope of changing energy along surface layer.
It is reasonable to assume that value of effective thickness of surface layer should be close enough to the length of chemical bonds that is for purposes of most rough estimation could be considered as 0.1 nm.
Table 1 presents calculation of effective thickness of surface layer for several liquids these have well defined in handbooks necessary values to relay on:
| Liquid |
ΔH, J/cm3,
(vaporization) |
σ, erg/cm2 |
Ls, nm |
| Acetic acid | 414 | 27.6 | 0.133 |
| Acetone | 426 | 23.7 | 0.111 |
| Diethyl ether | 264 | 17 | 0.128 |
| Ethanol | 660 | 22.27 | 0.067 |
| Glycerol | 1255 | 63 | 0.100 |
| n-Hexane | 219 | 18.4 | 0.167 |
| Isopropanol |
575 |
21.7 |
0.075 |
| Mercury | 10000 | 487 | 0.097 |
| Methanol | 871 | 22.6 | 0.051 |
| Water | 2443 | 75.64 | 0.0619 |
As Table 1 shows that calculated values of Ls are intact with our assumption. Average value Ls for these ten liquids is 0.099 ±0.028 nm that is in very good agreement with initial assessment.
Thus usage of formula (1) with actual value specific change of
enthalpy at phase transition and effective value of thickness
of surface layer taken as 0.1 nm should result estimation of
surface energy with accuracy no worse than 50%.
References:
1. Surface Tension of Crystals, Safa Kasap, Department of Electrical Engineering. University of Saskatchewan. Canada,
Sep. 26, 2017; 14:40 EST