Statistics user interface in LeoDataAnalysis
Depend on active combination of number arguments, values and selected statistical scheme "Statistics" tab of LeoDataAnalysis has corresponding set of controls to chose available conditions to apply.The "Statistics" tab of LeoDataAnalysis is aim for selection and tuning up statistical scheme.
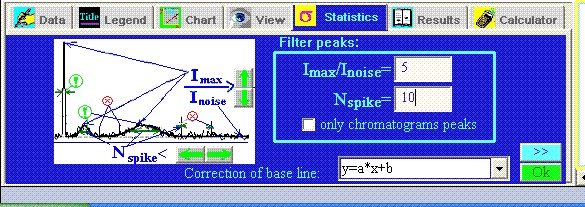
For example here is the appearance of the "Statistics" tab for revealing gauss-like peaks for X-ray or mass-spectrometer output.
Following table gives basic list of statistical schemes implemented in LeoDataAnalysis:
| Arguments | Values | Series | Available statistical schemes |
|
>=2 (combined) |
>=1 | Correlation matrix | |
| 0 | >=1 | >=1 | Distribution and conditional distribution, fit by distribution formulas like (Student, Erlang, Poison) |
| 0 | 2 | >=1 | Maximum density. |
| 1 | >=1 | >=1 | Curve fitting by: polynomial formula, harmonic analysis by Fourier series, from list of formulas, user defined formula, peaks revealing. |
| >=2 | >=1 | >=1 | Multivariate approximation by quasi-plane and quasi-parabolic surface, by best fitting polynomial series, auto search of best polynomial fit, by user defined formula, by user defined unitary argument, testing near neighbors method validity. |
A selection of active statistical scheme is also depended on current visualization scheme. For user who is mostly related on intuitive learning without bothering to read all manuals step by step the tip is to check tab "View" if desirable statistical scheme is not revealed itself at "Statistics" tab. Changing the view from linear to histogram will also change available statistical schemes from quasi time series fitting to distribution analysis.
In more details applicability of statistical schemes implemented in LeoDataAnalysis is discussing in specific articles devoted to each of them.